
Lab-tested: entry-process mechanism simulated in our lab — nginx 1.26.3 · PHP-FPM 8.4.27 · 16 November 2026 · cPanel paths from official cPanel and CloudLinux documentation
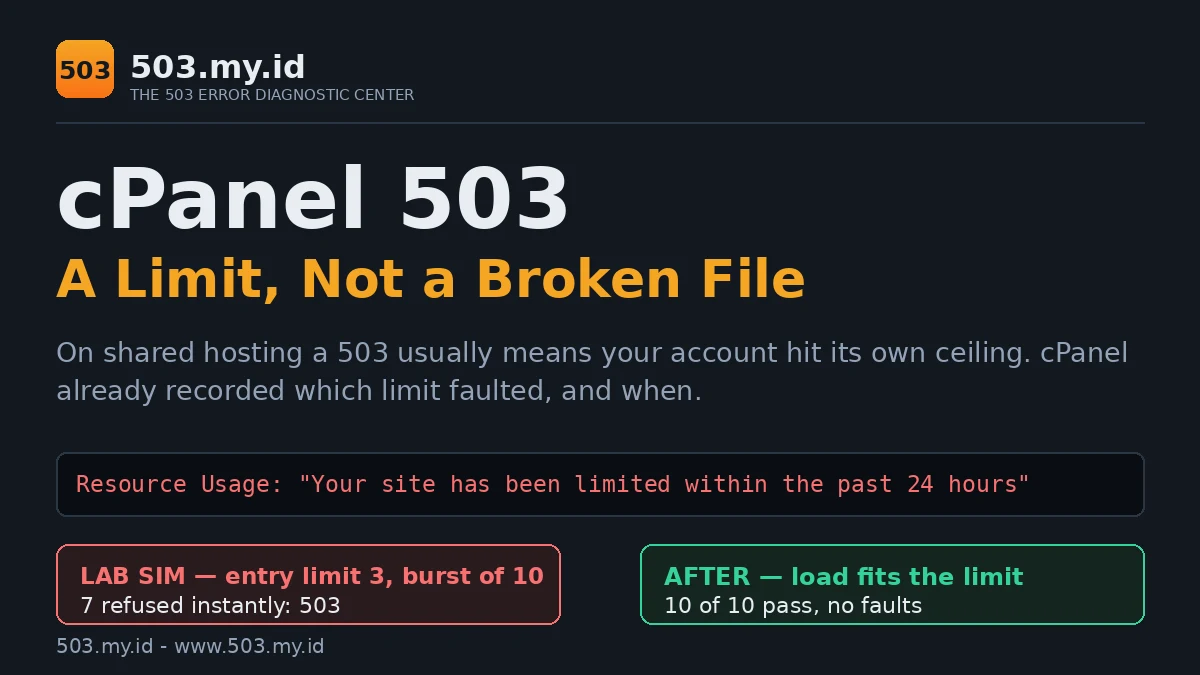
On shared hosting, a 503 usually means your account hit a resource limit — not a broken file.
- Open cPanel → Resource Usage and check for limit faults today.
- Open Metrics → Errors and note the exact time of the last 503.
- If limits are maxed, reduce load first (cache plugin, cron jobs, bots) before asking your host to raise anything.
“503 Service Unavailable” Plus a Full Resource Usage Graph
The shared-hosting 503 has a tell: it heals itself.
Pages fail for a few minutes, then recover untouched.
Nobody fixed anything. The load simply dropped.
Meanwhile, cPanel has been keeping score.
Open Metrics → Resource Usage and read the dashboard sentence:
Your site has been limited within the past 24 hoursThat sentence means your account hit its own ceiling.
The server is fine. Your neighbours are fine.
Only your account’s requests were refused, briefly.
Some hosts show a sibling page for the same wall:
508 “Resource Limit Is Reached” is stock CloudLinux wording.
Many Apache and LiteSpeed hosts dress the same fault as 503.
The number differs. The diagnosis below is identical.
Seeing the error from outside your account helps too:
Our 503 Checker confirms the status your visitors get.
Read cPanel First: Resource Usage, Errors, and PHP Selector
Three cPanel screens answer almost every shared-hosting 503.
Resource Usage → Dashboard. One verdict sentence covers the last 24 hours.
It names which resource triggered the limit, if any.
Resource Usage → Details. Graphs per resource, against your limit line.
CPU, memory, entry processes, processes, I/O, IOPS.
A fault is one moment usage hit the ceiling.
Count faults, and note the minutes they happened.
Resource Usage → Snapshots. What was running at the fault.
Snapshots list processes, database queries, and HTTP requests.
That list usually names the guilty script directly.
Metrics → Errors. Your error log, newest lines first.
Match its timestamps to the fault minutes from Details.
Same minute, same story, from two independent records.
PHP Selector (Software section) is the third screen — carefully.
It sets PHP version, extensions, and per-request options.
Its memory_limit governs one request, not your account.
It cannot raise LVE limits. Hosts set those, not you.
Treating PHP Selector as the fix is the classic false trail.
It returns in What Did Not Work, below.
The Usual Limits Behind a 503: Entry Processes, I/O, PHP Workers
CloudLinux wraps each account in an LVE — a private resource cage.
These are the cage walls that produce a 503:
| Limit | What it counts | What visitors see |
|---|---|---|
| Entry Processes (EP) | Scripts entering your account at the same moment | New requests refused: 503, or 508 on stock pages |
| CPU (SPEED) | Processing share; 100% means one full core | Everything slows, then errors under load |
| Physical Memory (PMEM) | RAM held by your account’s processes | Processes killed; 500 or 503 pages |
| Number of Processes (NPROC) | All processes, including cron and SSH | Fork failures; 500 or 503 errors |
| I/O and IOPS | Disk throughput and operations per second | Slow pages hold entries longer, causing EP faults |
Entry Processes is the wall most sites meet first.
EP counts concurrency, not visitors per hour.
One slow page holds its entry until it finishes.
Twenty slow pages at once fill a twenty-entry account.
Cached and static pages never touch PHP, so they cost nothing.
That is why homepages can fail while images load fine.
On a VPS, this same wall wears a different name:
the PHP-FPM pool, covered in our PHP-FPM 503 guide.
There you can raise the pool yourself, within RAM.
Here, the ceiling belongs to your plan.
Your only levers are load and evidence.
Cron Jobs and Bots: The Load You Did Not Invite
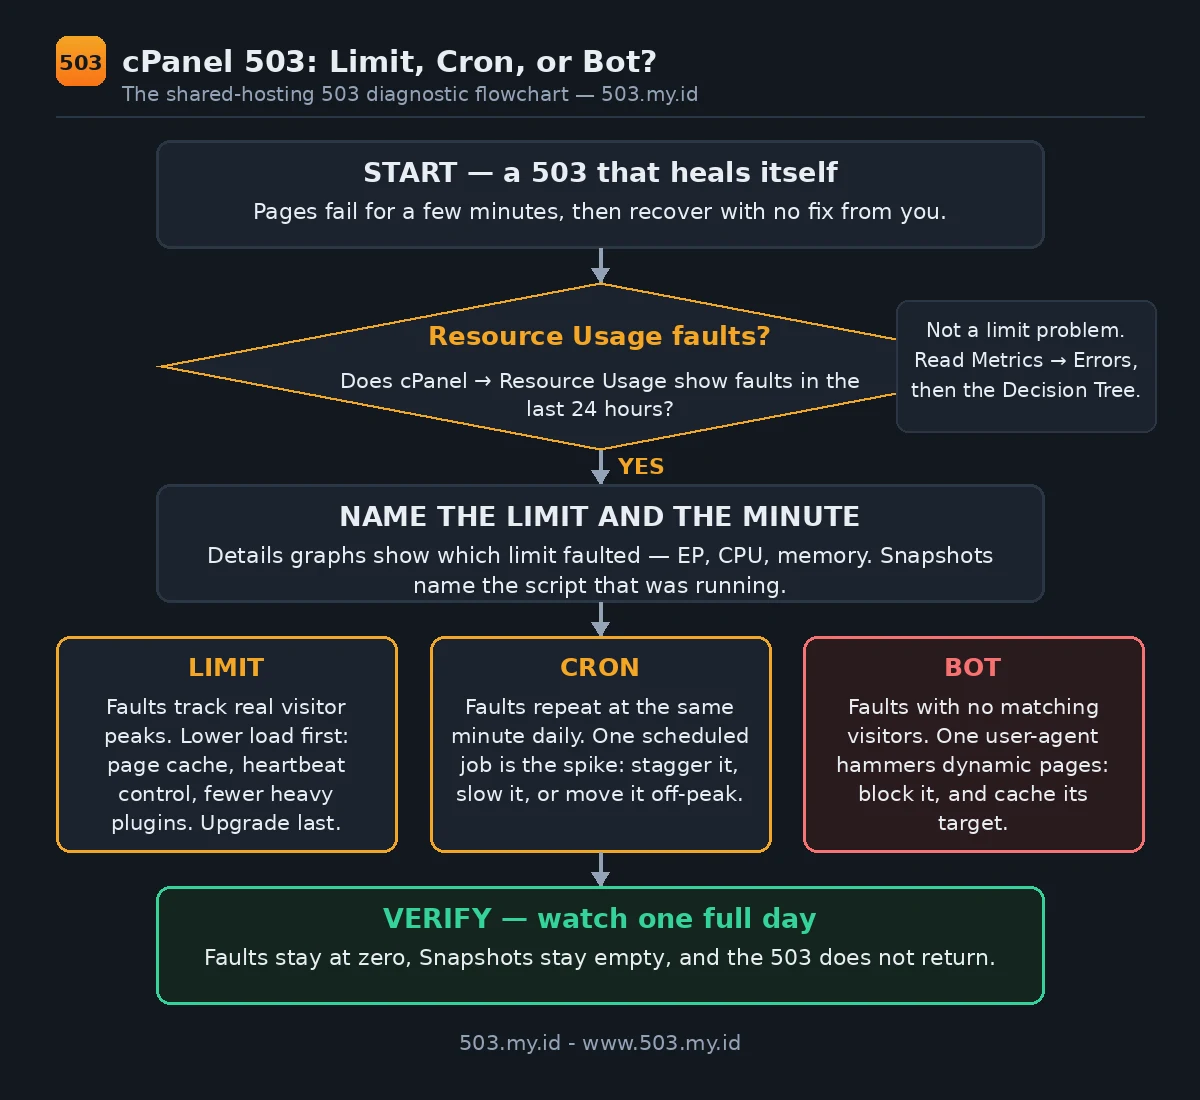
Half of all limit faults are self-inflicted scheduling.
Backups, imports, and sitemap builds love the same minute.
Three heavy jobs starting together are a traffic spike.
WordPress adds its own: WP-Cron fires on visitor requests.
A quiet site can stack overdue jobs into one burst.
The signature is unmistakable in Resource Usage:
faults at the same time, every day, like clockwork.
The other half arrives uninvited: bots.
Crawlers hammer login pages, search URLs, and feeds.
They request the slowest, least cacheable pages you own.
And they never queue politely like human visitors.
cPanel → Metrics → Raw Access shows who actually came.
One user-agent dominating dynamic pages is your culprit.
Our lab rounds below imitate exactly this pattern:
three scheduled bursts, same refusals, every single round.
Uninvited load needs no volume — just concurrency and slow pages.
Lower the Load (Cache, Heartbeat, wp-cron) Before You Upgrade
Every fix below shrinks concurrency or shortens requests.
Turn on full-page caching. Cached pages bypass PHP entirely.
Each cached page is an entry process freed instantly.
For WordPress sites this is the single biggest win — see the WordPress 503 guide.
Tame the WordPress heartbeat. Each logged-in user polls admin-ajax constantly.
Editors and dashboards quietly hold entries all day.
Lengthen the heartbeat interval, or disable it outside the editor.
Discipline your cron jobs. List every job in cPanel → Cron Jobs.
Stagger heavy jobs apart; move backups off-peak.
Replace WP-Cron with one real system cron, on your schedule.
Block abusive bots early. Stop them before PHP wakes up.
A firewall rule or .htaccess block costs no entry process.
Prune slow plugins. A ten-second request holds its entry ten seconds.
Shortening requests raises your effective ceiling without paying anyone.
These habits are one chapter of the full 503 prevention guide.
Only after this list should limits enter the conversation.
And that conversation goes better with evidence — next section’s companion template.
Our Lab Reproduction (Mechanism Simulated in Our Lab)
Honesty first: this lab has two layers, labelled everywhere.
We hold no spare cPanel or CloudLinux account to fault.
And production hosting accounts are never load-tested, ever.
So the mechanism was simulated on our own stack:
an entry gate in front of a healthy PHP-FPM pool.
Every cPanel screen reference follows official documentation instead.
Nothing in this section claims a real cPanel screenshot.
The simulation setup
Stack: nginx 1.26.3 and PHP-FPM 8.4.27, Debian 13.
The pool behind the gate was deliberately oversized: ten workers.
The gate allowed three concurrent dynamic entries per client.
That gate is the analogue of an LVE Entry Processes limit.
Excess entries were refused with 503, before PHP saw them.
The test page slept ten seconds, holding its entry.
Before — a burst of ten against a gate of three
- 3 requests passed, each completing in about 10.0 seconds.
- 7 requests refused instantly — 503 in under 0.01 seconds.
- Error log, verbatim:
limiting connections by zone "lab7ep". - A static file during the burst: 200 in 0.0004 seconds.
- Even a fast PHP page during the burst: instant 503.
- The FPM log stayed silent — zero pool-full lines.
Read that last line twice; it is the whole lesson.
PHP had seven idle workers the entire time.
Refusals happened at the gate, exactly like an LVE fault.
Your cPanel fault counter is that gate’s log line.
The cron pattern — three scheduled bursts
- Three bursts of eight, spaced like scheduled jobs.
- Every round identical: 3 passed, 5 refused with 503.
- No damage, no stuck state — each round self-healed.
That is why limit 503s feel haunted:
the site breaks on schedule and recovers on schedule.
After — two recoveries, two different lessons
- Load stopped: the same slow page answered 200 again.
- Nothing was changed, restarted, or repaired.
- Gate raised from 3 to 10: all ten requests passed.
- Only then did the pool log its first
max_childrenline.
Raising the gate exposed the next ceiling behind it.
On cPanel, raising EP works the same way:
it helps real growth, and merely relocates a spike problem.
The full logs, configs, and scripts ship with this article’s lab notes.
What to Send Your Host (Copy-Paste Template)
Support teams answer evidence, not adjectives.
“My site is down” starts an interrogation.
The message below answers it in advance.
It is free to copy and quote, with credit to 503.my.id.
Subject: 503 errors and resource-limit faults — [domain] — [date]

Hello Support Team,

My site returned 503 Service Unavailable, and cPanel Resource Usage
shows my account was limited within the past 24 hours.

Details from my side:
- Domain: [example.com]
- When the 503 appeared (with timezone):
  [e.g. 16 November 2026, 09:12–09:40 WIB (UTC+7)]
- Limit that faulted in Resource Usage → Details:
  [Entry Processes / CPU / Physical Memory / I/O]
- Fault count shown: [e.g. EP faults: 27]
- What Snapshots showed at that minute:
  [script name or process, if visible]
- Pages affected: [homepage / checkout / wp-admin / all pages]
- The site recovers by itself after a few minutes: [yes / no]

What I have already done:
- Turned on full-page caching.
- Reduced WordPress heartbeat and admin-ajax load.
- Checked Cron Jobs for overlapping schedules.
- Checked Raw Access for one bot or user-agent dominating requests.

Please confirm:
1. The exact LVE limits on my account (EP, CPU, PMEM, NPROC, I/O).
2. Whether these faults match your server-side records.
3. Whether any process from my account is still stuck running.
4. If the load is legitimate, which limit raise or plan change
   you recommend, and what it costs.

Thank you,
[Your name]
[Account username / customer ID]
Before sending, gather these five facts:
- Which limit faulted, and at what times (Details).
- The script or process Snapshots named.
- The exact minute of the last 503 (Errors).
- Every cron job and its schedule.
- Whether one user-agent dominates Raw Access.
With those attached, most hosts skip straight to answers.
What Did Not Work
Blaming PHP. Our first suspect was the worker pool.
Its log stayed silent through every fault round.
Requests never reached PHP, so pool tuning changed nothing.
Raising the wrong ceiling. Raising the gate worked — briefly.
The pool immediately became the next wall.
One raised number relocates a limit; it never removes load.
Waiting it out. Every burst healed itself within seconds.
That taught us nothing, and the next burst refaulted.
Self-healing is a symptom here, not a resolution.
The PHP Selector shortcut. Documentation is blunt about its scope:
memory_limit caps one request’s memory, nothing more.
It does not touch EP, CPU, or account fault counters.
And one honest non-experiment: no real cPanel account was faulted.
Production accounts are off-limits for load tests, permanently.
This article’s mechanism is simulated, and labelled that way.
FAQ
What are entry processes in cPanel?
The number of scripts entering your account simultaneously.
Not visitors per hour — entries at the same moment.
A slow page holds one entry until it finishes.
My host says “your site hit its limits” — what do I check?
Resource Usage → Details: which limit faulted, and when.
Snapshots: which script was running at that minute.
Metrics → Errors: the exact time of the last 503.
Will upgrading my plan fix a 503 permanently?
Only when the load is legitimate and still growing.
A bot burst or cron pile-up faults any plan size.
Lower the load first; upgrade what remains.
Why does my 503 happen at the same time every day?
A scheduled job: a backup, import, or cron task.
Check cPanel → Cron Jobs, and WordPress’s own WP-Cron.
Stagger the job, or move it to a quiet hour.
Sources and date: entry-process mechanism simulated 16 November 2026 on nginx 1.26.3 and PHP-FPM 8.4.27 (Debian 13).
cPanel screens, LVE limit definitions, and PHP Selector scope follow cPanel and CloudLinux documentation, checked 16 November 2026.
Leave a Reply