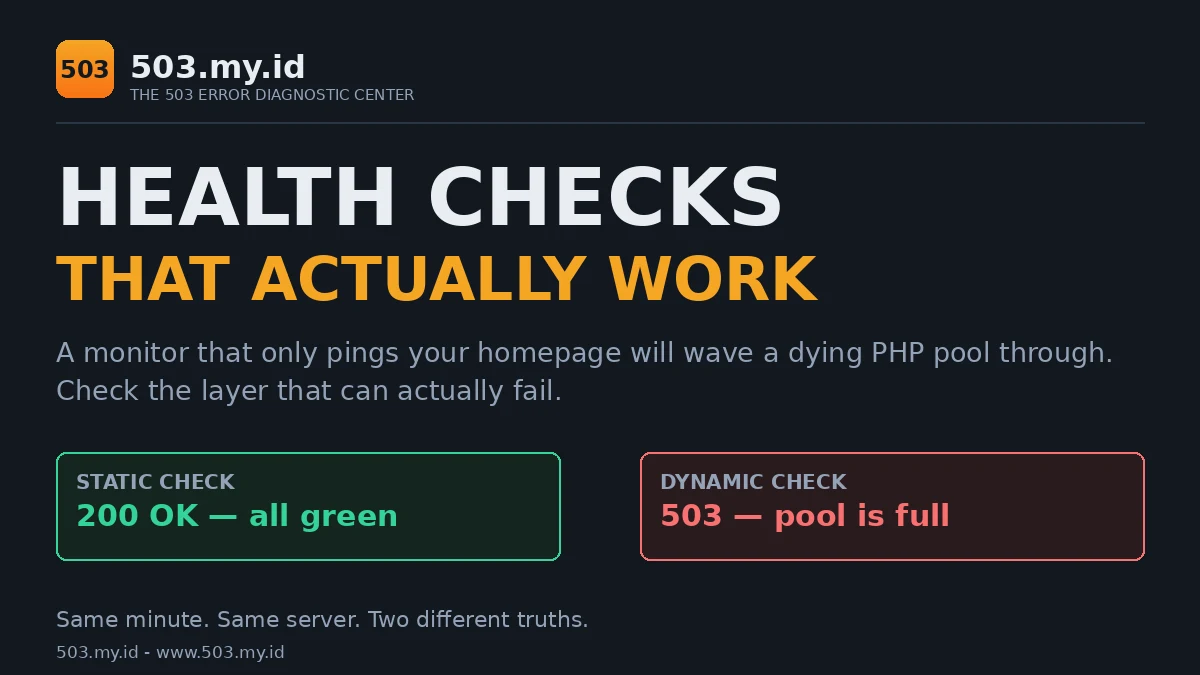
Proven in our lab on 16 November 2026 (nginx 1.26.3, PHP-FPM 8.4.27, Debian 13): one monitor stayed green through a real 503 — the other caught it in the same minute.
A health check that only pings your homepage will miss most 503s.
- Check a dynamic page or API endpoint, not just static HTML.
- Alert on worker saturation and slow origins, not only on downtime.
- Test your alert once — a monitor nobody hears is decoration.
Why “Up/Down” Monitoring Misses 503 Errors
Most uptime monitors ask one question: does the homepage answer 200?
A static homepage can answer 200 while every dynamic page is dead.
The web server serves static files itself. It never touches PHP.
So a full PHP-FPM pool is invisible to a homepage ping.
We proved this in our lab, in the same minute, on the same server:
- Static homepage during a full pool: 200 in about 1 millisecond, every check.
- Dynamic health endpoint at the same moments: 503, four checks in a row.
Three more blind spots make 503s easy to miss.
Intermittent 503s appear only under load, between your check intervals.
Per-path 503s hit checkout or one application, not the homepage.
Cached 200s let a CDN serve yesterday’s page over a dead origin.
A monitor is only as good as the layer it actually exercises.
For a one-off manual check right now, use the 503 Checker.
For watching around the clock, build the checks below.
The 3 Layers to Check: Edge, Origin, and the Worker Pool
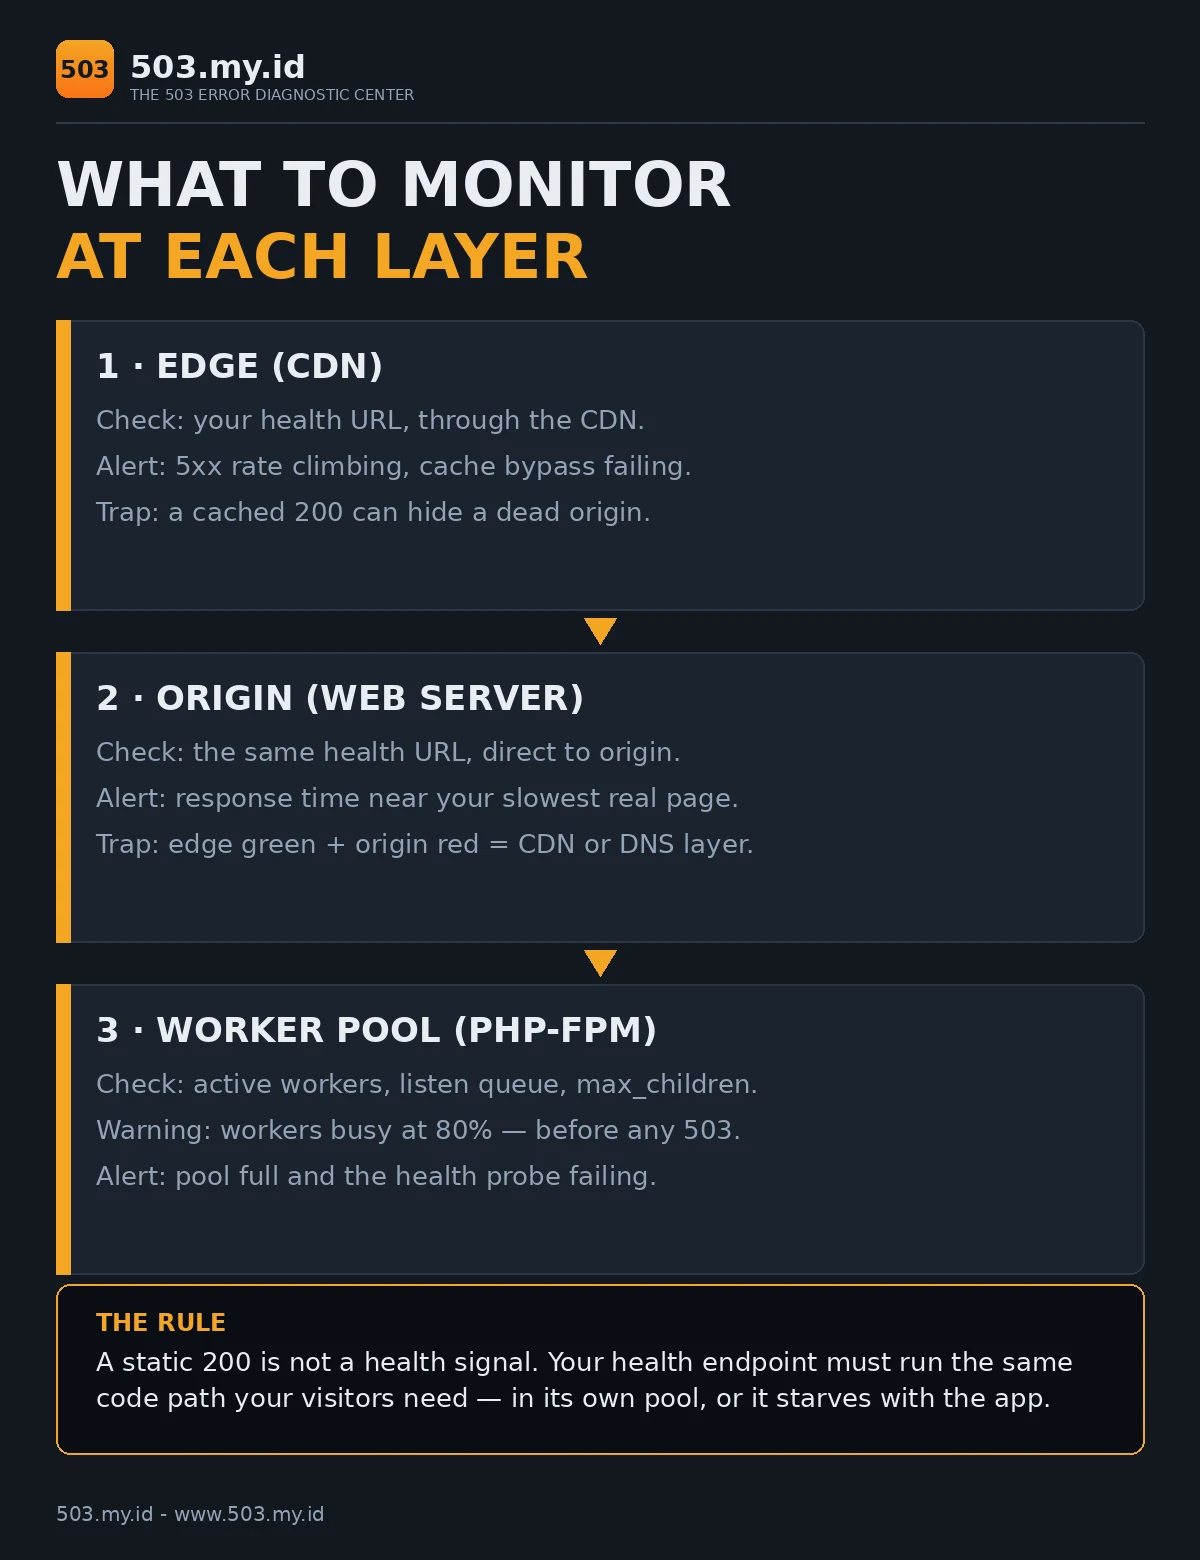
Every request crosses three layers. Each fails differently.
Edge. Check your health URL through the CDN, as visitors see it.
Edge failures point at CDN rules, DNS, or TLS — not your server.
How to tell whose 503 it is: the Cloudflare 503 guide.
Origin. Check the same health URL directly at the server.
Edge green plus origin red isolates the problem to the server itself.
Worker pool. Watch PHP-FPM’s own counters, not just responses.
Active workers, listen queue, and the max-children counter are early warnings.
They move minutes before visitors see the first 503.
The pool layer is where our lab’s failure lived.
Its guide, with the log line that proves it, is the PHP-FPM pool guide.
Readiness vs Liveness: The Difference That Prevents Bad Restarts
Kubernetes popularised two words worth stealing for any stack.
Liveness asks: is the process alive at all?
Readiness asks: can it take a new request right now?
A busy PHP worker is alive but not ready. Both answers are true.
Restarting on a failed readiness check makes overload worse.
The restart kills in-flight work and the queue returns instantly.
Our health endpoint is a readiness check, deliberately.
It answers 503 while the app pool is full, without touching the pool.
One design rule follows: the checker must not share the pool it checks.
Our first endpoint draft ran inside the app pool itself.
During saturation it never answered at all — it starved in the same queue.
The shipped version runs in its own two-worker pool, beside the app.
That separation is the whole trick. Everything else is thresholds.
What to Alert On: Thresholds From Our Lab’s 503 Tests
Downtime alerts arrive late. Saturation alerts arrive early.
In our lab, a warning at 80% busy preceded full failure.
Four slow requests held four of five workers, and the warning fired:
WARNING 2026-11-16T15:37:31Z worker saturation: app workers busy at/above 80% threshold while health still HTTP 200The thresholds we publish, all exercised in the lab:
| Signal | Warning | Alert |
|---|---|---|
| Pool workers busy | 80% or more (lab: 4 of 5) | Pool full, probe failing |
| Health endpoint | Answers “degraded” | HTTP 503 or no answer |
| Listen queue | Above zero, twice running | Growing for five minutes |
| max_children counter | Rose since yesterday | Rose in the last hour |
Our lab poller alerted on the first failing check, for a short test.
In production, require two consecutive failures before paging anyone.
Single blips are network noise; two in a row are a pattern.
One honest limit: a sudden spike skipped “degraded” entirely.
Our saturation run jumped from healthy to failing between two checks.
Early warning needs rising load, or a shorter check interval.
The full template — endpoints, metrics, thresholds — is copy-ready:
Health Check Configuration Template (Markdown)
Thresholds are one habit inside a bigger one: how to prevent 503 errors.
A Minimal Health Endpoint
The endpoint does three things: probe the app, read its counters, answer JSON.
Ours lives at /health.php, in a separate FPM pool named health.
Nginx exposes it to localhost and the monitor only:
location = /health.php {
    allow 127.0.0.1;
    deny all;
    include fastcgi_params;
    fastcgi_param SCRIPT_FILENAME $document_root$fastcgi_script_name;
    fastcgi_pass unix:/data/home/prod/lab14/run/health.sock;
    fastcgi_read_timeout 15s;
}
We verified the restriction from the machine’s non-loopback address: 403.
The app pool exposes its counters with pm.status_path = /app-status.
The endpoint probes a light dynamic page with a two-second timeout.
Probe fails: HTTP 503. Workers at 80%: HTTP 200, degraded. Otherwise: ok.
Healthy answer, verbatim from our lab:
{
    "status": "ok",
    "time": "2026-11-16T15:36:58+00:00",
    "checks": {
        "app_probe": "pass",
        "app_workers_active": 1,
        "app_workers_idle": 1,
        "app_workers_max": 5,
        "app_listen_queue": 0,
        "max_children_reached_total": 0
    },
    "duration_ms": 131
}
Sick answer, same endpoint during saturation (fields the code emits):
{
    "status": "error",
    "checks": {
        "app_probe": "fail",
        "app_workers_active": null,
        "app_workers_max": 5
    }
}
Note the null: the status request itself queued behind the full pool.
The probe’s verdict, not the counters, is what flipped us to 503.
Design for that: one signal must be able to fail you alone.
Our Lab Reproduction
Stack: nginx 1.26.3, PHP-FPM 8.4.27, Debian 13, one lab machine.
App pool: five workers. Health pool: two workers, separate socket.
Two lab pollers played the external monitor, checking every five seconds.
Monitor A checked the static homepage. Monitor B checked /health.php.
Run one — rising load. Four slow requests, twenty-five seconds each.
Workers busy hit four of five; the saturation WARNING fired at 15:37:31Z.
The endpoint answered “degraded”, still HTTP 200, until the load cleared.
Run two — full saturation. Five slow requests, one second apart.
A sixth queued inside FPM and tripped the pool’s own warning line:
[16-Nov-2026 15:42:18] WARNING: [pool app] server reached pm.max_children setting (5), consider raising itOne second later, Monitor B went red and the alert was recorded:
ALERT 2026-11-16T15:42:19Z health endpoint failing: http=503 status=errorThe combined log, same timestamps, both monitors:
2026-11-16T15:42:19Z A: http=200 (1ms) | B: http=503 status=error (3508ms)
2026-11-16T15:42:27Z A: http=200 (1ms) | B: http=503 status=error (3506ms)
2026-11-16T15:42:36Z A: http=200 (2ms) | B: http=503 status=error (3507ms)
2026-11-16T15:42:44Z A: http=200 (2ms) | B: http=503 status=error (3508ms)
2026-11-16T15:42:53Z A: http=200 (1ms) | B: http=200 status=ok
Monitor A never blinked: 200 in one to two milliseconds, every cycle.
The same-pool health file, requested mid-saturation, timed out at eight seconds.
Recovery was recorded too: RECOVERED at 15:42:53Z, nine seconds after release.
Alert delivery here means a timestamped line in the monitor’s alert log.
We registered no external paging service; the mechanism is identical.
What Did Not Work
Our first saturation attempt never filled the pool.
With a listen backlog of one, extra requests were refused at the socket.
They returned instant 502s, and the fifth worker never got used.
Monitor B stayed green-ish — “degraded” — and no alert fired.
Raising the backlog to 32 let requests queue inside FPM instead.
Only then did max_children trip and the health probe truly fail.
Lesson: your monitor can only see the failure your stack actually produces.
A health file inside the app pool. It starved with everything else.
During saturation it answered nothing for eight seconds, then a 504.
Silence is ambiguous; a separate pool turns it into a clear 503.
Trusting the status page alone. Its request queues like any other.
One recovery-cycle reading came back with worker counts null.
The probe still answered, so the verdict stayed correct.
Long web-server timeouts hide saturation. Our slow requests showed 504.
Nginx gave up at eight seconds while workers stayed busy for forty.
The client saw a timeout; the pool saw a continuing outage.
FAQ
How often should a health check run?
Once a minute suits most sites; our lab used five seconds.
Short intervals catch short outages, at the cost of more noise.
Whatever you choose, alert on two consecutive failures, not one.
What is a health endpoint?
A small URL that reports whether the application can actually work.
Unlike a homepage, it exercises the dynamic path: code, workers, dependencies.
It answers structured JSON, so monitors can read more than a status code.
Why did my uptime monitor miss a 503?
It probably checked a static or cached page, or the wrong path.
In our lab the static check stayed green through a complete PHP outage.
Point the monitor at a dynamic endpoint that shares your visitors’ path.
Should a health check test my database?
Yes — with one cheap, time-boxed query, not a real page load.
A database that hangs should fail the check, not hang the checker.
Cap every sub-check with its own timeout, like our two-second probe.
Sources and date: Lab reproductions run 16 November 2026 on nginx 1.26.3 and PHP-FPM 8.4.27 (Debian 13).
Monitoring principles follow the Google SRE Book; readiness and liveness follow Kubernetes probe documentation. The 503 definition follows RFC 9110 §15.6.4.
References
- Google SRE Book — Monitoring Distributed Systems (sre.google).
- Kubernetes Documentation — Configure Liveness, Readiness and Startup Probes.
- RFC 9110 §15.6.4 — 503 Service Unavailable (IETF).
- PHP Manual — PHP-FPM Configuration (pool directives, pm.status_path).
- nginx documentation — ngx_http_fastcgi_module and access restrictions (allow/deny).
Leave a Reply