
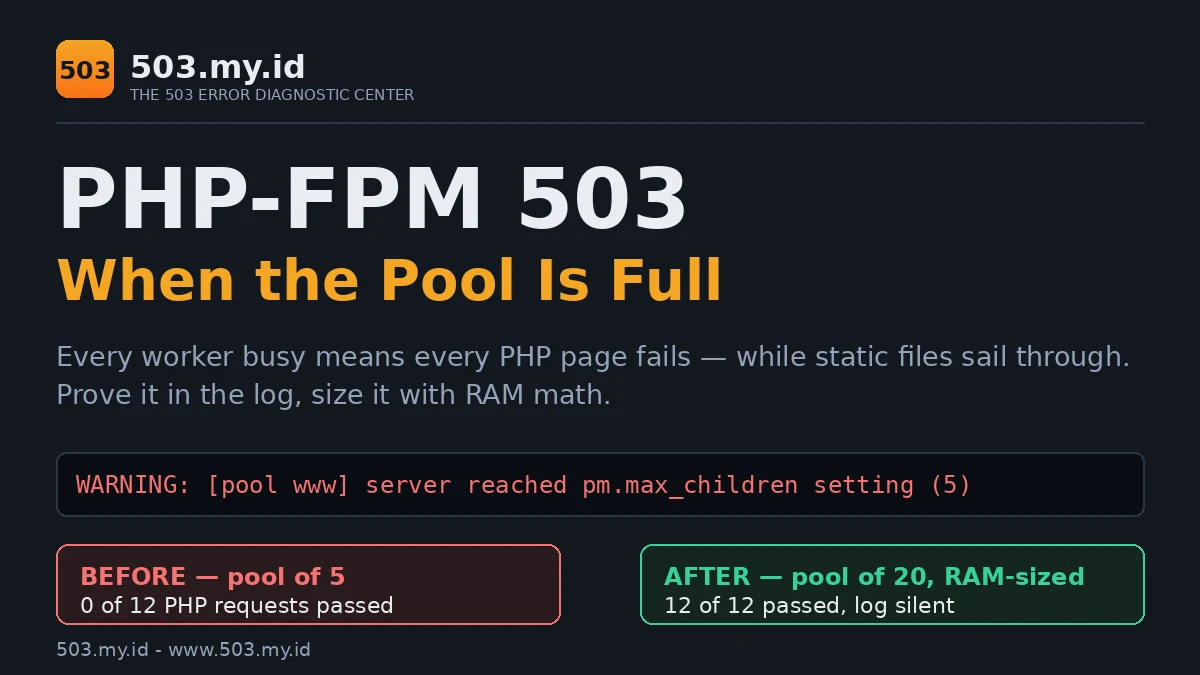
We filled the pool on purpose: PHP-FPM 8.4.27 behind nginx 1.26.3 and Apache 2.4.71 hit the max_children line on 16 November 2026 — and the right-sized pool below passed every request that had failed.
This exact log line means every PHP worker is busy — new requests get a 503.
- Confirm it: search your FPM log for
server reached pm.max_children. - Find what is holding workers (slow plugin, cron, bot flood) before raising any limit.
- Raise
pm.max_childrenonly within your RAM budget — the formula and safe values are below.
“503 Service Unavailable” With a Healthy Web Server
The strangest 503 is the one where half your site still works.
Static files — images, CSS, plain HTML — answer instantly.
Every PHP page hangs, times out, or errors.
That split is the fingerprint of a full PHP-FPM pool.
The web server is fine. It simply has nobody to hand PHP requests to.
Our lab reproduced the split exactly, on both web servers:
- Static HTML during saturation: 200 in 0.0005 seconds (nginx) and 0.0007 seconds (Apache).
- A fresh PHP page at the same moment: refused or timed out, every time.
Depending on your stack, visitors may see 503, 502, or 504.
Apache and LiteSpeed hosting commonly dresses this failure as 503.
Nginx more often reports 502 or 504 for the same full pool.
Do not diagnose by the number. Diagnose by the log line, next.
Not sure a pool is even involved? The 503 Decision Tree routes you in five questions.
The Log Line That Proves It
One line in the PHP-FPM master log settles the question.
Here it is, verbatim, from our lab reproduction:
[16-Nov-2026 15:02:01] WARNING: [pool lab9] server reached pm.max_children setting (5), consider raising itIt fired four times across our saturation runs.
Each firing marks a moment when every worker was busy.
New requests arriving then had three possible fates.
They queued in the socket backlog, they were refused, or they timed out waiting.
Where to find your own FPM log:
- Debian/Ubuntu packages:
/var/log/php8.x-fpm.log - cPanel:
/usr/local/cpanel/logs/php-fpm/and per-domain error logs - Custom builds: the
error_logpath in yourphp-fpm.conf
Search it for max_children. No line, no pool problem.
Your cause then lives elsewhere — start with the Nginx 503 guide.
FPM log lines, decoded
| Log line | Meaning | First move |
|---|---|---|
server reached pm.max_children setting (N) |
All N workers busy; requests refused or queued | Slowlog, then RAM math |
child N exited on signal 9 (SIGKILL) |
Kernel OOM killer shot a worker | Pool is oversized for RAM — shrink it |
child N exited on signal 11 (SIGSEGV) |
A worker crashed on a bug or bad extension | Disable recent extensions, check core dumps |
execution timed out, terminating |
One request passed request_terminate_timeout |
Read that request’s slowlog trace |
Why Workers Fill Up: Slow Code, Cron Pile-Up, Bot Traffic
A worker is one PHP process. It serves one request at a time.
Anything that stretches a request stretches your whole pool.
Slow code. One script waiting twenty seconds on a database or API holds its worker hostage.
Five such scripts exhaust a five-worker pool completely.
Cron pile-up. Scheduled jobs that overlap — backups, imports, sitemap builds — arrive as a worker convoy.
They all start together, and they all hold workers together.
Bot traffic. Crawlers do not queue politely like humans.
A burst of fifty bot requests in one second is a pool-full event.
The fix differs per cause, which is why the order matters:
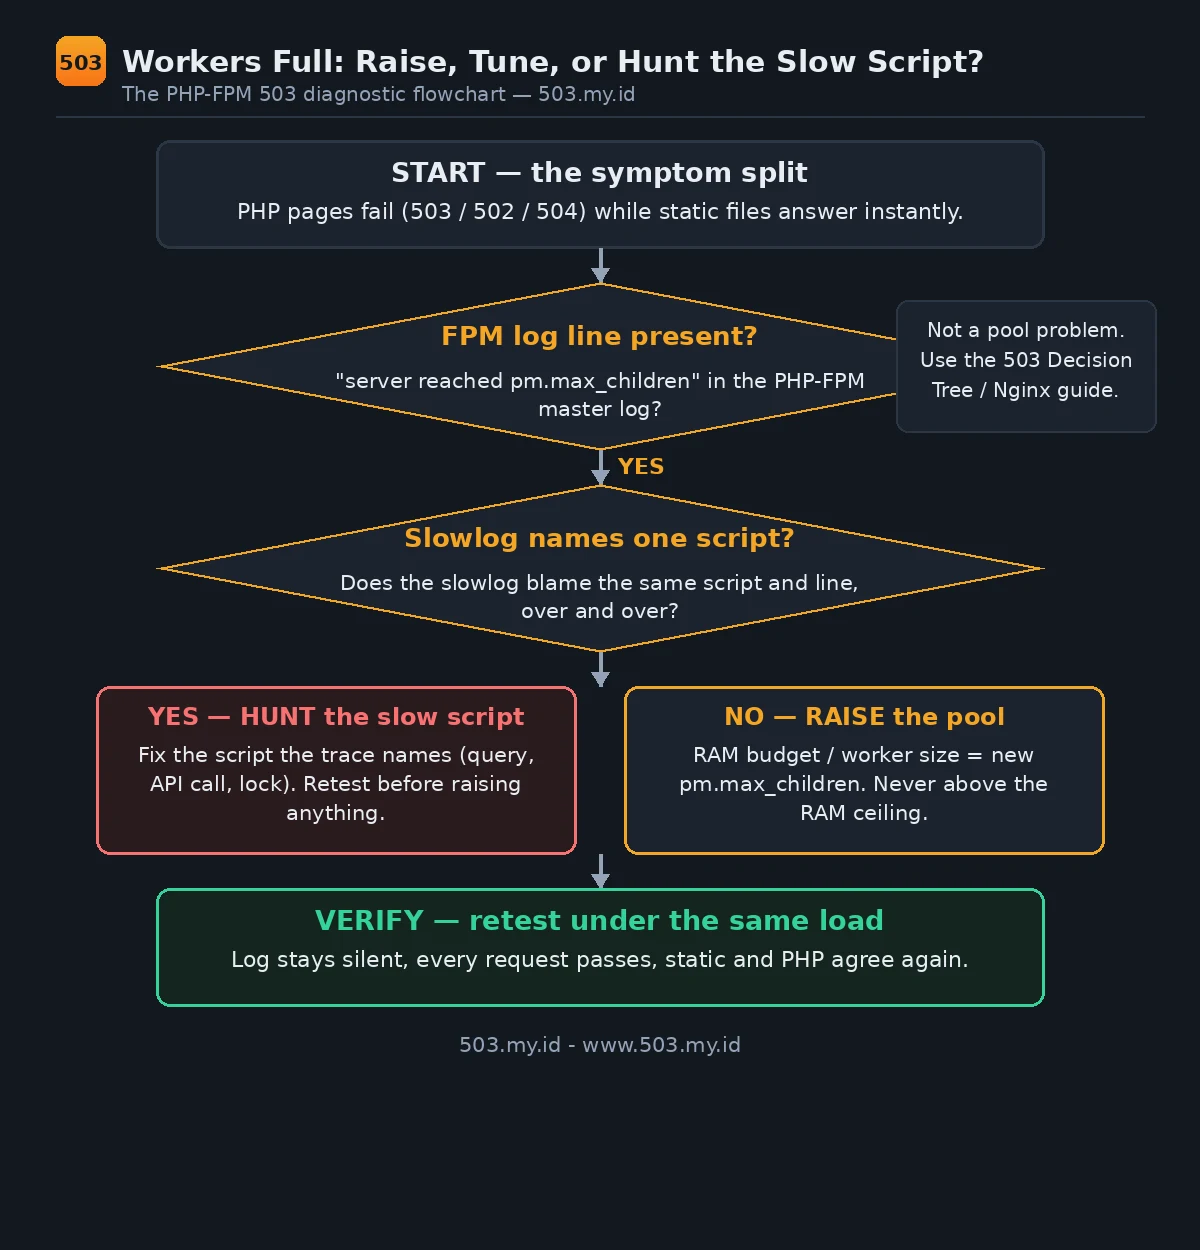
First prove the pool is full (the log line). Then find who is holding workers (the slowlog).
Only then decide whether the pool itself is undersized.
On shared hosting you cannot see this log — your version of the same wall is the cPanel resource-limit 503.
The RAM Math: How High Can max_children Safely Go?
Every worker costs real memory, whether it is busy or idle.
So the ceiling for pm.max_children is arithmetic, not taste:
max_children = RAM budget for PHP (MB) / memory per worker (MB)Measure your worker size under load, never from a fresh start.
Our lab measured it with ps while workers held a memory-heavy script:
- Worker RSS under load: about 60 MB (58.5–60.2 MB across five workers).
- Same workers, idle after the run: about 34 MB.
- Five memory-heavy requests raised machine memory used by ~260 MB.
Now the budget. Our lab machine has 8 GB of RAM.
The operating system, desktop, and other services already used about 5.5 GB.
We allowed PHP a conservative 1.2 GB of the remaining headroom:
1,200 MB / 60 MB per worker = 20 workersThat 20 became our tested pm.max_children — see the lab results below.
For a typical 2 GB VPS running only a web stack:
Reserve roughly 500 MB for the system and database, leaving about 1.5 GB.
At 60 MB per worker, the ceiling is 25 — start at 15–20 and watch the log.
Your worker size will differ. WordPress workers commonly measure 40–100 MB.
Measure yours during your busiest minute, then do your own division.
Tune the Pool: pm, pm.max_children, pm.max_requests, request_terminate_timeout
Below is the exact pool our lab verified, comments included.
It took the same attack from total failure to twelve out of twelve passes.
; Pool: www — right-sized for a 1,200 MB PHP budget, ~60 MB per worker
[www]
user = www-data
group = www-data
listen = /run/php/php8.4-fpm.sock
listen.owner = www-data
listen.group = www-data
listen.mode = 0660
; Queue short bursts in the backlog instead of refusing them.
listen.backlog = 64
pm = dynamic
; THE number. Budget (MB) / worker size (MB), never a guess.
pm.max_children = 20
pm.start_servers = 4
pm.min_spare_servers = 2
pm.max_spare_servers = 6
; Recycle each worker after 500 requests, before leaks grow.
pm.max_requests = 500
; Kill a truly stuck request at 60 s; log anything past 5 s.
request_terminate_timeout = 60s
request_slowlog_timeout = 5s
slowlog = /var/log/php-fpm/www-slow.log
catch_workers_output = yes
Three settings deserve a sentence each.
pm = dynamic keeps a standing army sized between the spare limits.
It suits mixed traffic; ondemand saves idle RAM but pays a spawn delay per burst.
pm.max_requests = 500 quietly retires workers before slow memory leaks become your problem.
request_terminate_timeout is the executioner of last resort — set it above your slowest legitimate page.
Apply changes with a graceful FPM reload, then retest under load.
A config that only survives an idle Tuesday proves nothing.
Right-sizing is one habit inside the full 503 prevention guide.
The max_children Calculator
Run your own numbers before touching the config:
Runs entirely in your browser. Nothing is stored or sent.
Slowlog: Catch the Script Holding Your Workers
Raising the pool treats the symptom. The slowlog names the disease.
With request_slowlog_timeout = 5s, FPM writes a stack trace for every slow request.
Our lab’s slowlog caught the culprit red-handed, seconds into the attack:
[16-Nov-2026 15:02:04]  [pool lab9] pid 265054
script_filename = /data/home/prod/lab9/www/slow.php
[0x00007f7cd1015090] sleep() /data/home/prod/lab9/www/slow.php:4
Script, line, and the exact function it was sleeping in.
On a real site the trace usually points at a database query, a remote API call, or a file lock.
Fix that script and the pool often shrinks back to healthy on its own.
Leave the slowlog on permanently. Its cost is a few lines per slow request.
Its value is that the next pool-full event arrives pre-diagnosed.
Pair it with worker-saturation alerts — health checks that watch the pool catch this before visitors do.
Our Lab Reproduction (Log Before–After + Worker Counts)
One machine, one pool, two web servers, tested 16 November 2026.
Stack: PHP-FPM 8.4.27, nginx 1.26.3, Apache 2.4.71, Debian 13.
The weapon: a lab script that sleeps twenty seconds per request.
The attack: twelve parallel requests against a five-worker pool.
Before — pool of 5, backlog of 4
- nginx: 5 requests refused instantly (502, under 2 ms); 7 queued past the 10-second read timeout (504).
- Apache: all 12 requests timed out (504, 10–30 s); error log filled with
AH01075: Error dispatching request. - Static HTML, same moment: 200 in under a millisecond, both servers.
- FPM log:
server reached pm.max_children setting (5)— fired in both rounds. - Slowlog: traces naming the sleeping script within four seconds.
Zero of twelve PHP requests completed cleanly through either server.
The web servers disagreed on the error code; the FPM log did not care.
After — pool of 20 by the RAM math, backlog 64
- nginx: 12 of 12 requests returned 200 (20.0–24.9 s — the script’s own sleep, plus pool ramp-up).
- Apache: 12 of 12 returned 200 (20.0–22.0 s).
- FPM log: zero new
max_childrenlines during the entire fix run. - FPM status: max active processes 12, max children reached: 0.
Same script, same twelve requests, same machine.
Only the pool configuration changed (web-server timeouts were raised to 30 s so the pool — not the timeout — was the variable under test).
The full before–after logs, configs, and scripts ship with this article’s lab notes.
What Did Not Work
Chasing the status code. Our first instinct was to hunt a “real 503”.
The same saturation produced 502s and 504s on two mainstream servers.
The number is the web server’s accent. The log line is the diagnosis.
Short web-server timeouts. Our 10-second proxy timeouts killed even healthy, in-flight requests.
A timeout below your slowest real page manufactures errors during any burst.
Raising the limit without the math. We did the arithmetic instead of the accident:
At 60 MB per worker, pm.max_children = 200 would need 12 GB — on an 8 GB machine.
The kernel’s OOM killer would then shoot workers mid-request (the SIGKILL line in the decoder table).
Five memory-heavy lab requests alone added ~260 MB of memory used.
Scale that by forty and the machine, not the pool, becomes the outage.
Restarting FPM as a fix. It clears the queue and the evidence together.
Ten minutes later the same slow script refills the same small pool.
FAQ
Is raising pm.max_children dangerous?
Only beyond your RAM. Inside the budget formula it is the correct fix.
Beyond it, the OOM killer starts shooting workers — a worse outage.
Why do static files work while PHP pages show 503?
Static files never touch PHP-FPM. The web server serves them itself.
PHP pages need a free worker, and a full pool has none.
What is a safe pm.max_children for 2 GB RAM?
With 60 MB workers and ~1.5 GB left after system and database: 25 is the ceiling.
Start at 15–20, watch the log for a week, then adjust.
Where is the PHP-FPM log?
Usually /var/log/php8.x-fpm.log on Debian/Ubuntu, or the error_log path in php-fpm.conf.
Search it for max_children — that one word confirms or clears the pool.
Sources and date: Lab reproductions run 16 November 2026 on PHP-FPM 8.4.27, nginx 1.26.3, Apache 2.4.71 (Debian 13).
Pool behaviour, slowlog, and directive meanings follow the PHP Manual. The 503 definition follows RFC 9110 §15.6.4.
References
- PHP Manual — PHP-FPM Configuration (pool directives, process manager).
- PHP Manual — PHP-FPM: slowlog and request_slowlog_timeout.
- RFC 9110 §15.6.4 — 503 Service Unavailable (IETF).
- nginx documentation — ngx_http_fastcgi_module (read timeouts, upstream errors).
- Apache httpd 2.4 documentation — mod_proxy_fcgi and ProxyTimeout.
Leave a Reply