

Mechanism lab-tested 18 November 2026 on an equivalent shared-hosting lab (nginx 1.26.3, PHP-FPM 8.4.27); hPanel screens and limits follow Hostinger’s documentation, checked the same day.
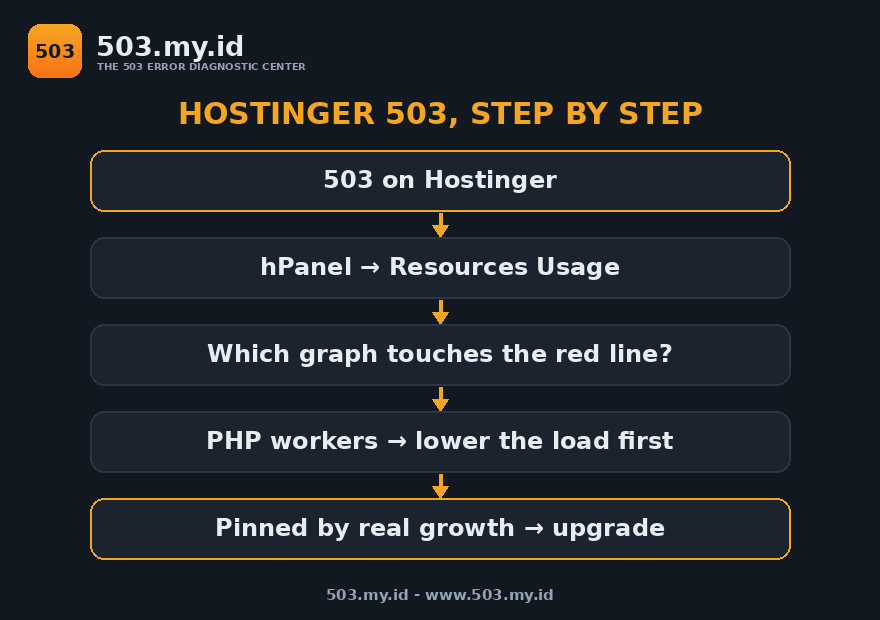
On Hostinger, a 503 almost always means a plan limit — and Hostinger names the wall “PHP workers”:
- Open hPanel → Websites → Dashboard → Hosting plan → Resources Usage. Find which graph touches its red line.
- If PHP workers max out, lower the load first: caching on, cron staggered, slow plugins pruned.
- Upgrade only when the graph shows legitimate growth pinned at the limit — not a spike you can remove.
Read hPanel First: Resources Usage
Hostinger keeps score in one place.
The path: Websites → Dashboard → Hosting plan → Resources Usage.
The page charts CPU, memory, I/O, and PHP workers.
Also IOPS, max processes, disk, and inodes.
A red line on each chart marks your plan’s limit.
Red shading shows the minutes you spent above it.
Hostinger says the data refreshes every 10 to 15 minutes.
It is recorded in GMT+0 — convert before matching timestamps.
That conversion trips up more diagnoses than any limit.
Your 503 at 14:05 Jakarta time sits at 07:05 on the chart.
Match the fault minute first; the guilty graph names itself.
A graph pinned flat at its line is a different story.
That shape means sustained demand, not a momentary spike.
The verdict section below treats the two shapes separately.
New to limit faults generally? The cPanel guide covers the twin system.
PHP Workers: Hostinger’s Name for the Entry Wall
A PHP worker builds one uncached page at a time.
When every worker is busy, new requests queue.
Queue long enough and the visitor receives a 503.
Hostinger publishes the counts in its plan parameters.
Checked 18 November 2026: Single allows 20 workers.
Premium allows 40; Unlimited allows 60.
Cloud Startup allows 100, for the next tier up.
Those numbers are concurrency, not monthly visitors.
Forty workers serve thousands of readers on cached pages.
They serve forty simultaneous uncached requests — no more.
One slow page holds its worker until it finishes.
Twenty slow pages at once halve a Premium plan.
That arithmetic, not traffic volume, is what faults.
Hostinger’s own support pages tie worker exhaustion to delays.
And RAM or process limits to outright 503 responses.
The wall is real, named, and printed in your panel.
Our Lab: The Same Wall, Measured
Honesty first: there is no Hostinger account in our lab.
Production accounts are never load-tested, ours or anyone’s.
So we built the equivalent: an entry gate before a pool.
The gate allowed three concurrent entries; the pool had ten workers.
Ten parallel ten-second requests hit that gate.
Three passed and completed. Seven were refused instantly.
Refusals took under 0.01 seconds each — no queue, a wall.
During the burst, static files answered in 0.0016 seconds.
The PHP log wrote zero lines the entire time.
The workers were idle; the gate did all the refusing.
That is the exact signature your Resources Usage graph shows.
Workers or entries flat at the limit, everything else calm.
We also reproduced the scheduled version of the fault.
Three bursts of eight, spaced like cron jobs: 3 passed, 5 refused.
Every round identical, every round self-healed.
Hostinger cron lives at hPanel → Advanced → Cron Jobs.
If your faults arrive on the clock, start there.
Raise the Limit or Lower the Load? Our Verdict
The bank question behind this article, answered with data.
We ran both strategies against the same wall.
Raising the gate from three to ten passed the burst.
Ten of ten requests completed.
Then the pool behind it logged its first ceiling line:
server reached pm.max_children setting (10), consider raising itRaising one wall had relocated the failure to the next.
Lowering the load kept the gate at three.
A cache layer went in front of it instead.
Twenty requests then needed three origin executions total.
Every request answered 200; the gate never filled.
Our verdict, without hedging: lower the load first.
It is free, it is permanent, and it compounds.
Raise limits only for growth you can see and name.
A graph pinned at the line by real readers, all week.
Not for a bot burst. Not for a cron pile-up.
Those follow you to the bigger plan and fault there too.
Upgrade fits the site outgrowing its plan honestly.
It does not fit a site carrying removable weight.
Lowering the Load, Hostinger Edition
Turn caching fully on. Hostinger’s plans run LiteSpeed.
The LiteSpeed Cache plugin serves pages without waking PHP.
Every cached page is a worker freed — the lab’s winning move.
Move WP-Cron to a real cron. hPanel → Advanced → Cron Jobs.
One scheduled call replaces the per-visit pile-up.
Our cron rounds showed why: bursts fault, schedules do not.
Prune slow plugins. A ten-second request holds its worker ten seconds.
Shortening requests raises your ceiling without paying anyone.
The hog hunt is detailed in the WordPress 503 guide.
Check PHP settings in hPanel. Advanced → PHP Configuration.
Memory limit lives there — it caps one request, not the account.
Confusing the two is the classic false trail on every host.
Watch the graph for a week. One fault is an anecdote.
A daily pattern at the same minute is a schedule or a bot.
Both are removable; neither needs a bigger plan.
The full routine lives in the prevention guide.
What Did Not Work
Raising the gate as a diagnosis. It passed the test burst.
It also hid which wall had been at fault.
And the pool became the next failure immediately.
Blaming PHP for gate refusals. The log stayed silent.
Requests refused at an entry gate never reach PHP.
Tuning the pool changed nothing in that configuration.
Waiting out scheduled faults. Every cron round healed itself.
Every next round faulted again, identically.
Self-healing is a symptom here, never a resolution.
Testing on a production account. We did not, and would not.
The mechanism here is an equivalent lab build, labelled so.
Anyone offering to “test” your live Hostinger plan is selling risk.
FAQ
Where do I see why Hostinger returned a 503?
Resources Usage, via Websites → Dashboard → Hosting plan.
Find the graph touching its red line at the fault minute.
Remember the charts run in GMT+0, not your timezone.
How many PHP workers does my plan have?
Hostinger’s plan parameters: Single 20, Premium 40, Unlimited 60.
Cloud Startup lists 100. Checked 18 November 2026.
Your hPanel shows the limits of your exact plan version.
Will upgrading fix my 503 permanently?
Only when real, growing traffic pins the limit.
Bot bursts and cron pile-ups fault any plan size.
Our lab’s raised gate just moved the wall — lower load first.
Why does my 503 happen at the same time daily?
A scheduled job: backup, import, or cron task.
Check hPanel → Advanced → Cron Jobs and WP-Cron.
Stagger the job, or move it to a quiet hour.
Is Hostinger’s 503 the same as a cPanel 503?
The mechanism is twin: a per-account concurrency wall.
Hostinger calls the unit PHP workers; cPanel hosts count entries.
Diagnosis and fixes transfer almost one to one.
Sources and date: equivalent-lab reproductions run 18 November 2026 on nginx 1.26.3 and PHP-FPM 8.4.27; burst, gate, cache, cron results quoted from the runs.
hPanel paths, charts, and worker counts (Single 20, Premium 40, Unlimited 60, Cloud Startup 100) follow Hostinger’s documentation and plan parameters, checked 18 November 2026.
Leave a Reply